
Three ten baggers is a 200% gain, not a 300% gain
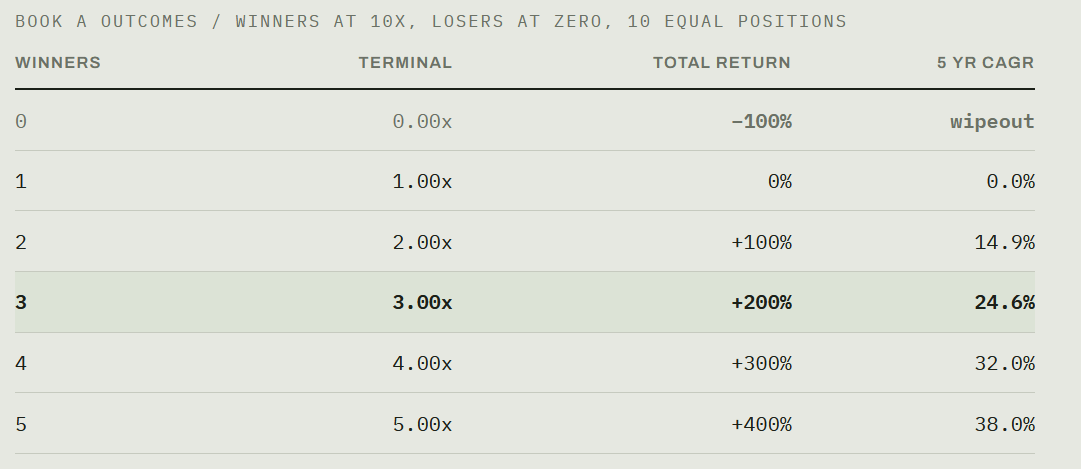
Start with the version of this that gets repeated on every podcast. You buy ten small caps at 10% each. You are looking for ten baggers. Three of them work. The other seven go to zero.
The intuition most people run is “three positions went up ten times, so I made 300%.” That is not what happened. Each winner turns 10% of capital into 100% of capital. Three winners give you 3.0x your starting money. Seven zeros contribute nothing. Your portfolio is worth three times what you put in, which is a 200% gain, not 300%.
Over five years, 3.0x compounds at 24.6% a year. That is a genuinely good number and I want to be fair to it. But look at what you had to do to get it: hit the single lowest probability outcome in public equities, three separate times, in a book of ten.
The real hurdle
In a ten-position book where losers go to zero, one ten bagger gets you back to flat. Not ahead. Flat. Two gets you 14.9% a year. Everything below two winners is a five year-round trip to nowhere or worse.
A ten bagger is only as good as its holding period
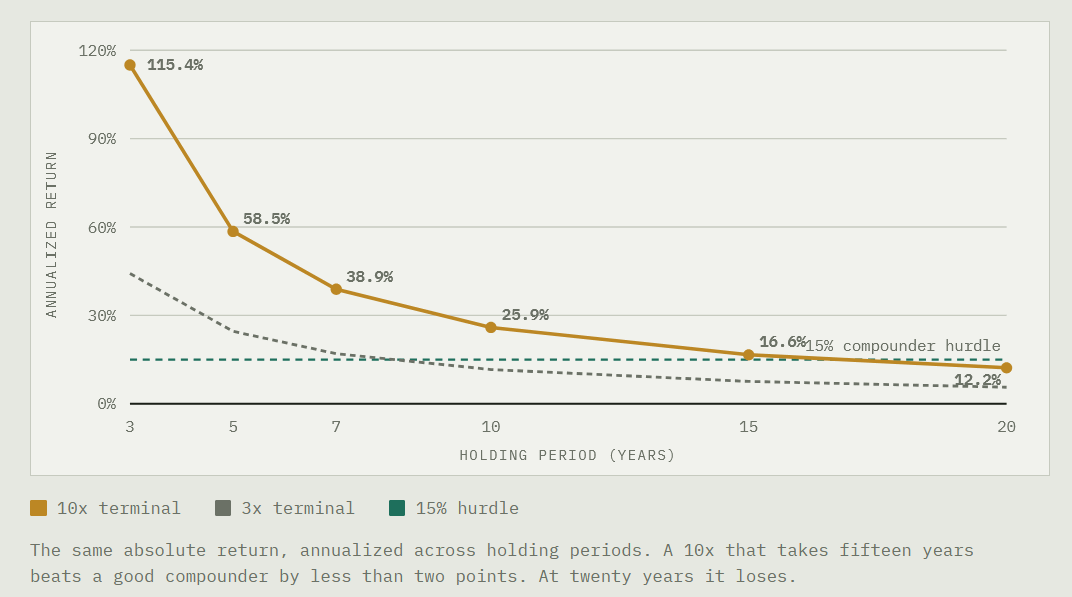
“Ten baggers” is a return with no denominator. It says nothing until you attach a number of years to it, and the years are usually the part nobody wants to specify, because most speculative theses need a long time to play out. Financings, permits, offtake, construction. None of it is fast.
Here is the same 10x at different holding periods, against a 3x for comparison.
This is the part that should change behaviour. A ten bagger that takes fifteen years is a 16.6% CAGR. A high quality business reinvesting internally at 15 to 20% gets you to roughly the same place without the financing risk, the permitting risk, the dilution, or the ten year stretch where you cannot tell whether you are early or wrong.
Stop using the average. Look at the distribution.
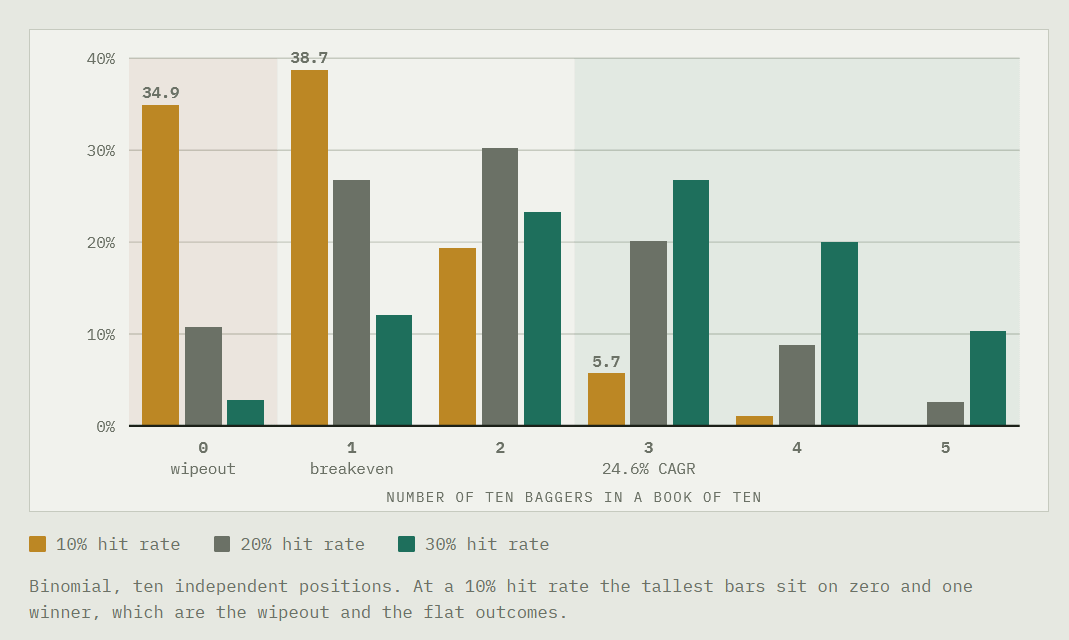
Everything above assumed you get exactly three winners. You do not get to assume that. If each position has some independent probability of being a ten bagger, the number of winners is a distribution, and the shape of that distribution is the whole story.
Below is the probability of landing each number of winners, at three different hit rates. Remember the two reference lines from earlier: one winner is breakeven, three winners is the 24.6% outcome.
Read the gold bars, because a 10% hit rate on ten baggers is already a flattering assumption for public market speculation. The two tallest bars are zero winners and one winner. That is a 34.9% chance of losing everything and a 38.7% chance of a five year round trip to flat. Together, roughly three in four outcomes leave you at or below your starting capital.
And expected value at a 10% hit rate is exactly 1.0x. Not “modest.” Zero. The three winner outcome you built the whole thesis around shows up 7% of the time.
Your instinct that “if you could raise your batting average it starts to make sense” is exactly right, and the table shows where the crossover sits. You need a 20.1% hit rate on ten baggers just to match a 15% compounder over five years, and 24.9% to match 20%. Those are not retail numbers. They are not really professional numbers either, outside of venture funds that get preferred shares, information rights, pro rata and a board seat.
Lower risk ways to speculate in mining ventures
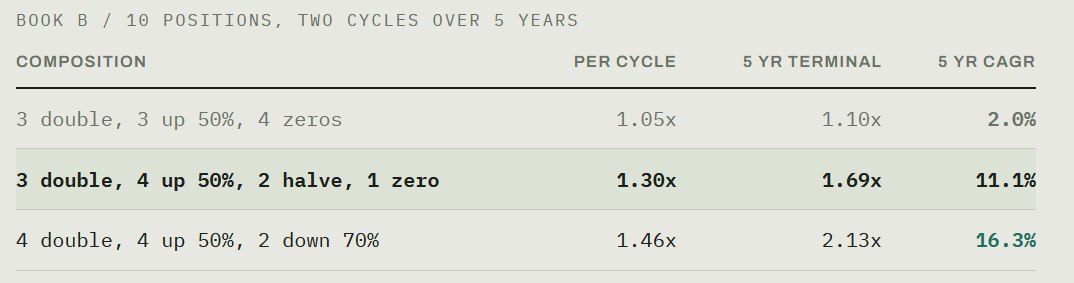
Now the other side of the trade, the pre production sweet spot (Lobo Tiggre et al). A developer that is permitted, financed and building. The classic pattern is a re rate through construction as the market moves it from a discounted NPV to a producing multiple, then a further move on first pour or first concentrate.
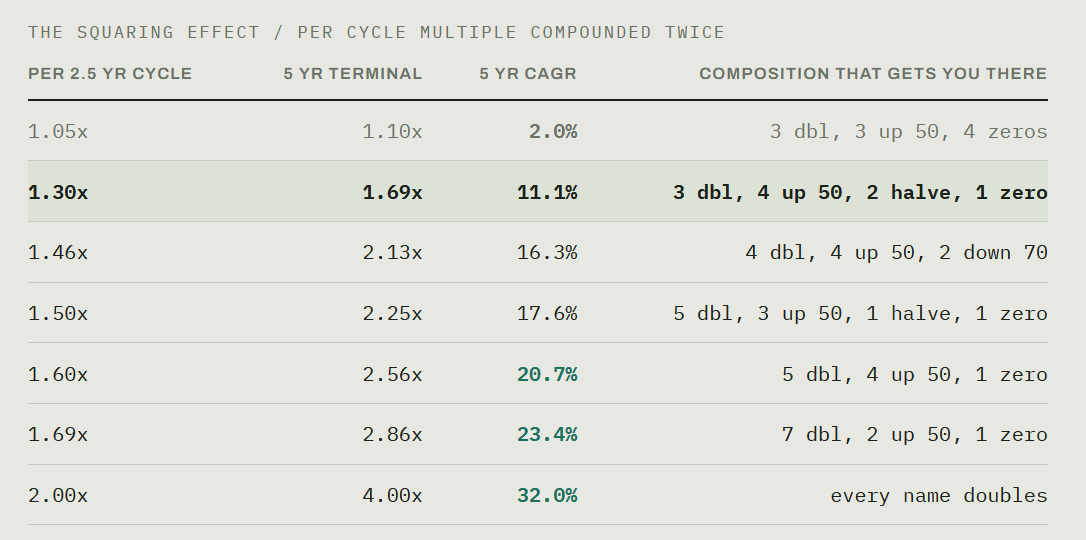
At 1.69x per cycle you compound at 23.4%, which is a dead heat with three ten baggers, and you get there with a book where the worst realistic case is a drawdown rather than a wipeout. But look at what 1.69x per cycle requires: something like seven of ten names doubling with only one failure. That is a very high bar, and it is worth being explicit that it is the bar, rather than letting it hide inside a single number.
Dispersion, not expected return
Take the middle pre-production book: 30% chance of a double, 40% chance of up 50%, 20% chance of a halving, 10% chance of a zero. Expected value per position is 1.30x. Standard deviation of a single position is 0.68.
Spread that across ten positions and the portfolio standard deviation collapses to 0.21. Your coefficient of variation is 16%. The probability of the whole book losing money in a cycle is about 8%.
Now do the same for the moonshot book at a 10% hit rate. Mean 1.0x, standard deviation 0.95. Coefficient of variation of 95%. You have not diversified anything. You have bought ten lottery tickets and the portfolio outcome is still essentially a coin flip on whether any of them hit.
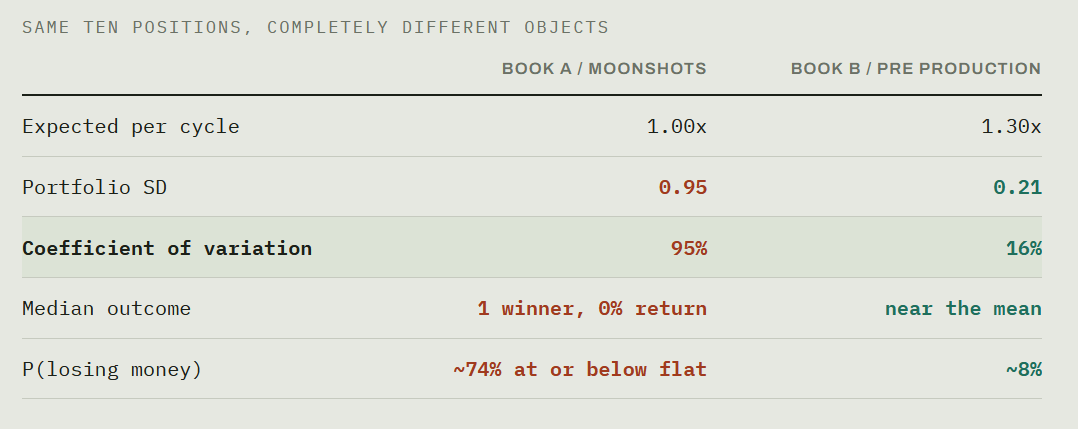
That is the real argument, and it is a strong one. Diversification does its job when outcomes are roughly symmetric. It does almost nothing when 90% of outcomes are zero, because averaging ten near certain zeros gives you a near certain zero. Ten names feel like risk management. On a lottery book it is not.
Ten positions diversify a book of businesses. It does not diversify a book of lottery tickets.
Ten juniors are closer to three bets
Every number above assumed the positions are independent. In junior mining they are emphatically not. A metals bear market, a shut financing window, a tax loss selling season, a shift in risk appetite. These hit the entire book at once, and the small caps hardest, and usually at the exact moment you need to raise cash.
Apply an equicorrelation of 0.3, which is conservative for ten names in one sector, and your ten positions behave like 2.7 independent bets. At 0.5 it is 1.8. At 0.7 you effectively own one position in ten wrappers.
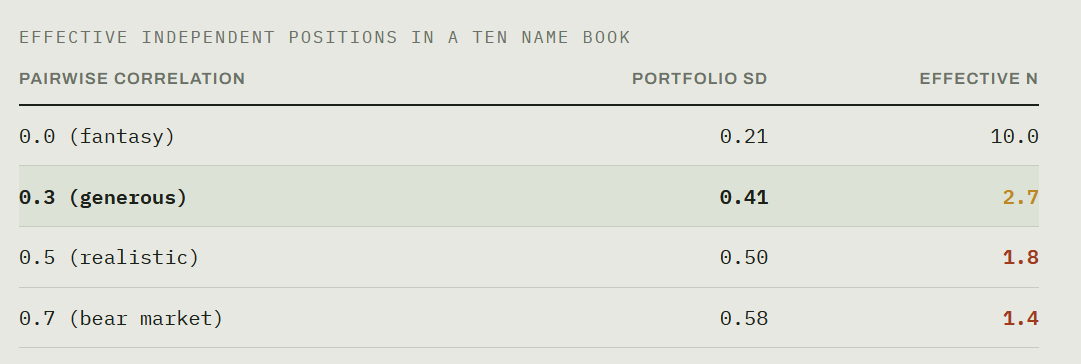
This is why the honest sleeve size is smaller than the model suggests. The diversification benefit you are counting on is roughly a quarter of what the arithmetic promises, and it disappears entirely in exactly the tape where you need it.
The bet size the math will support
Run a Kelly calculation on a single moonshot: pay one, receive ten with probability p, receive zero otherwise. The optimal fraction is (p × 9 − (1 − p)) / 9.
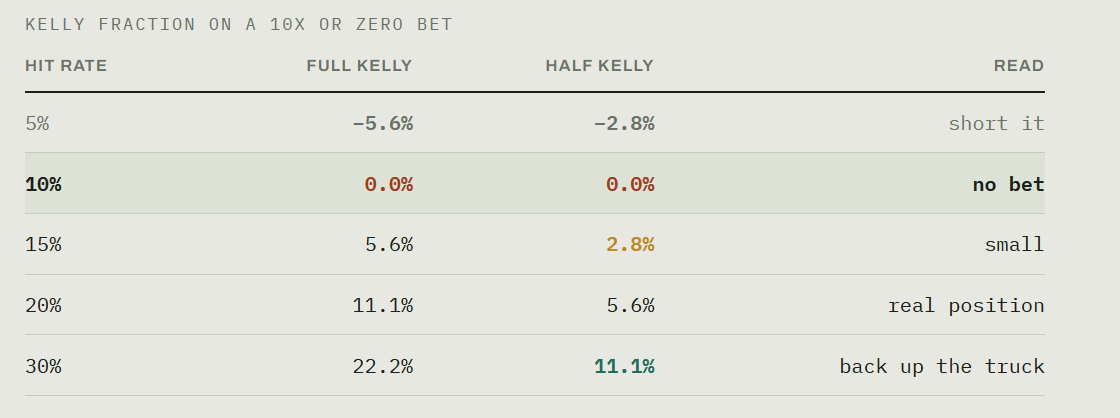
At a 10% hit rate the optimal size is zero. Below that it is negative. And this is before you haircut for the fact that you are estimating p yourself, on your own thesis, which is where the real error lives. We are systematically overconfident about our own hit rates, and the standard fix is to halve Kelly and then halve the p you fed it.
Where the 1% position comes from
If you genuinely believe you run a 15% hit rate on ten baggers, half Kelly says 2.8% per name. Apply a correlation haircut and an honest discount for your own optimism and you land somewhere near 1 to 1.5%. Which is roughly where experienced speculators end up by feel. Nice to know the arithmetic agrees.
The exercise to run before you size anything
None of this says do not speculate. It says price the speculation properly before you size it. The sequence is short and most people skip straight to step one and stop.
1. Write down the absolute return
Not the target price. The portfolio level terminal multiple, with the losers included. Three ten baggers in ten are 3.0x. Five doublers in ten is 1.0x on that half.
2. Attach an honest probability
Then run the distribution, not just the average. If your median outcome is flat, the mean is telling you a story about a world you will probably not live in.
3. Attach a holding period and annualize
Everything gets compared on a compounded basis or it does not get compared at all. Absolute returns without a time denominator are not comparable to anything.
4. Haircut for correlation
Count effective positions, not positions. Ten juniors is closer to three bets, and that number sets your sleeve.
5. Compare against the boring alternative
The relevant benchmark is not zero. It is what a broad index has historically delivered over long periods, roughly 10% nominal, or what a business reinvesting internally at a high rate can compound at with far less financing and permitting risk. If your probability weighted, correlation adjusted, annualized speculative return does not clear that by a wide margin, the speculation is not paying you for the risk. It is paying you for the story.
Which lands, for me, on a barbell. The bulk of the capital in businesses that compound internally, where the return does not depend on me being right about a specific catalyst on a specific date. Then a defined sleeve, sized at 1 to 2% positions, for the pre-production names where I think the odds are genuinely mispriced, and where a bad outcome is a 60% drawdown rather than a zero.
The ten bagger is not the problem. The ten baggers with no denominator, no distribution and no correlation adjustment is the problem. Once you write those three things down, it usually sizes itself.
Assumptions and caveats
All portfolios are ten equally weighted positions with no rebalancing within a cycle and no transaction costs, taxes or slippage.
Binomial outcomes assume independence between positions. Section 06 addresses why that assumption is wrong in practice and by roughly how much.
The pre-production outcome distribution (30% double, 40% up 50%, 20% halve, 10% zero) is illustrative. It is not derived from a sample of historical developer outcomes, and the whole result is highly sensitive to that failure rate.
Kelly is calculated for a single bet in isolation. Simultaneous correlated bets require a smaller fraction than the table shows.
The index figure cited is an approximate long run nominal return and is not a forecast.
Nothing here is investment advice, and no individual company is analyzed or recommended.